 Build
Build
Build your first trading algorithm
Now let’s turn a trading idea into an automated strategy. Reversion’s visual canvas lets you build algorithms by dragging nodes, connecting them, and configuring parameters — no code required.
-
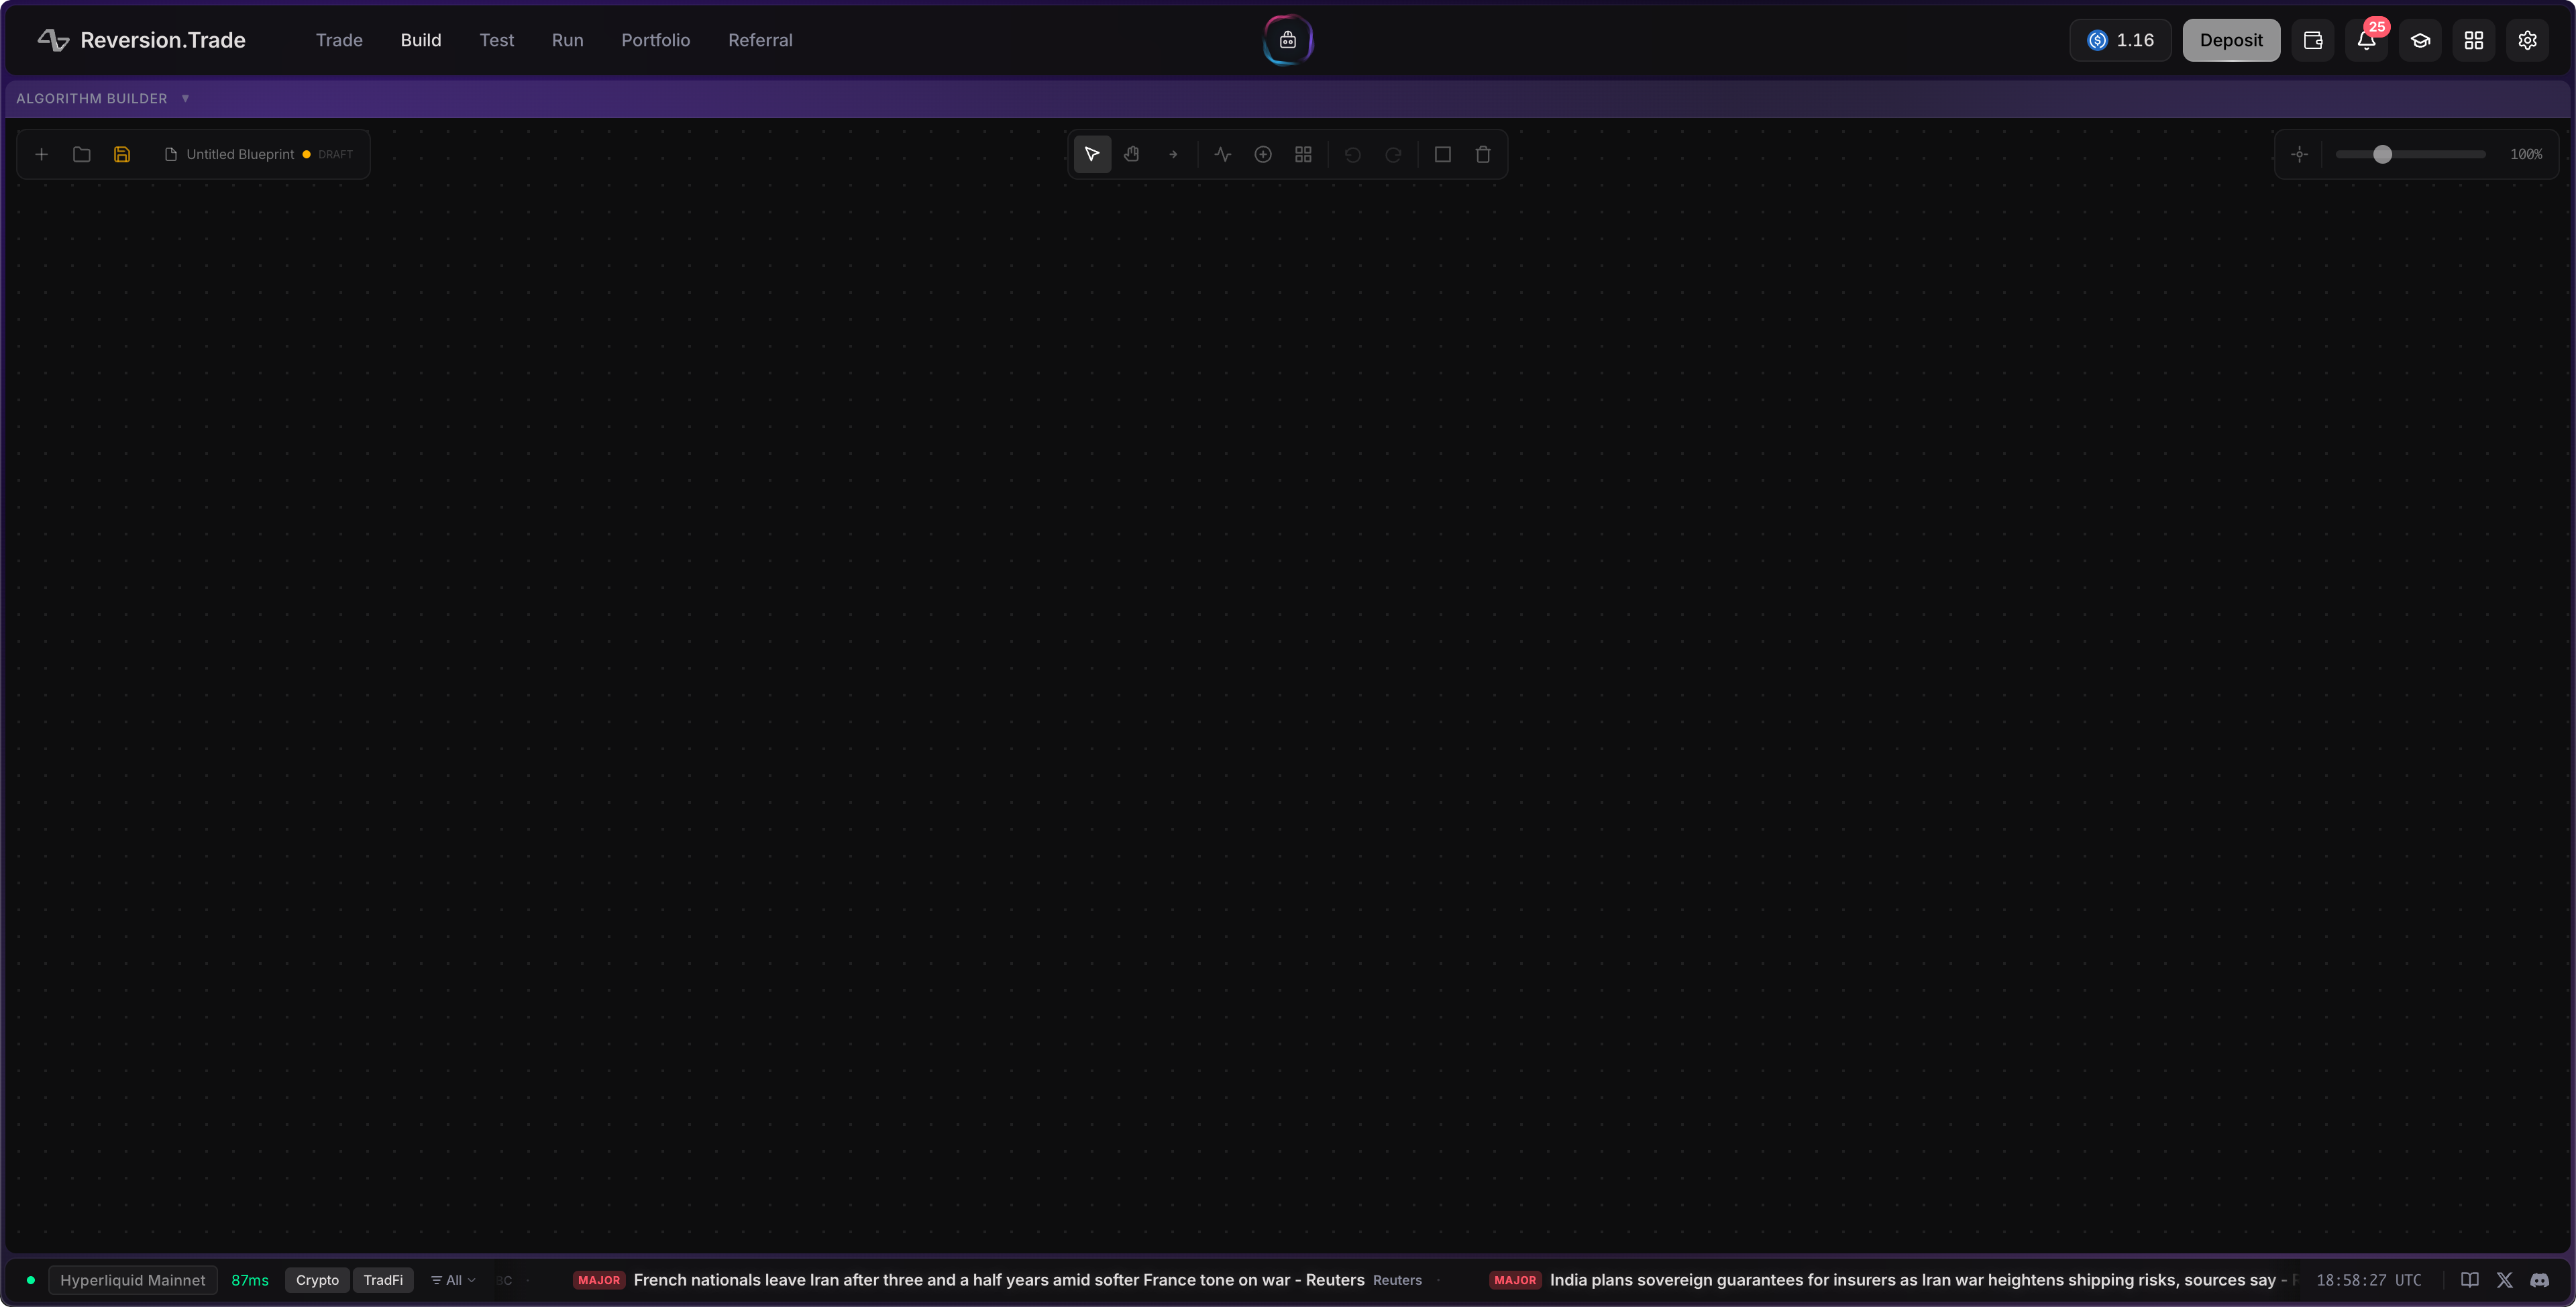
Switch to Build Mode
Click Build in the header mode selector. The interface switches to a full-screen canvas — a zoomable, pannable workspace where you’ll design your algorithm visually.
-
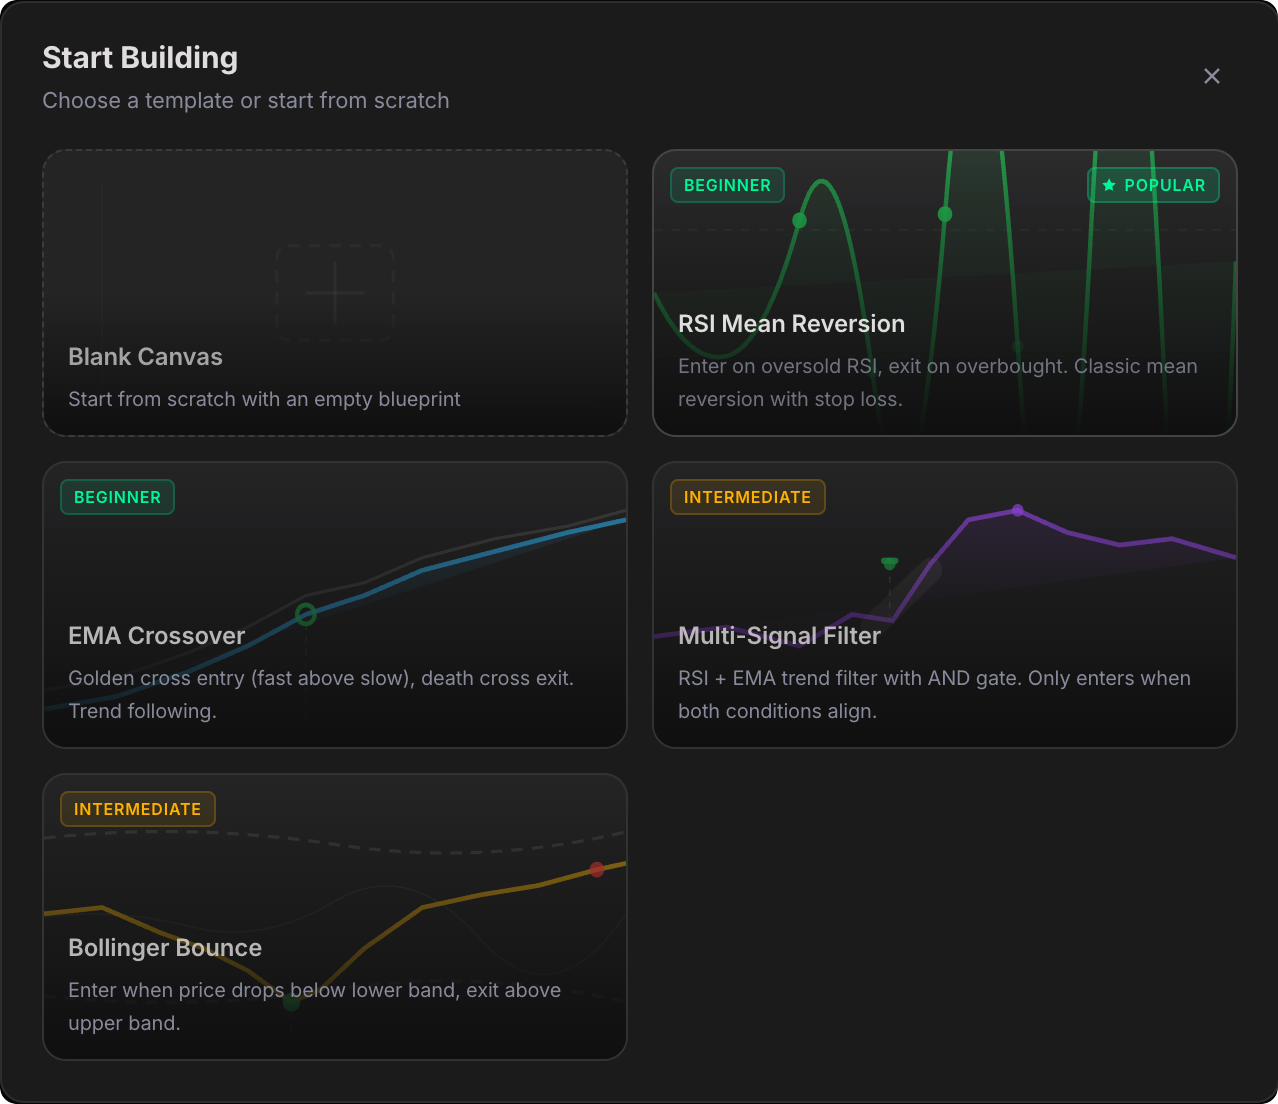
Start with a Template
Press T or click Templates in the toolbar to open the templates overlay. Select RSI Mean Reversion — it’s tagged as Beginner and gives you a ready-made strategy to explore.
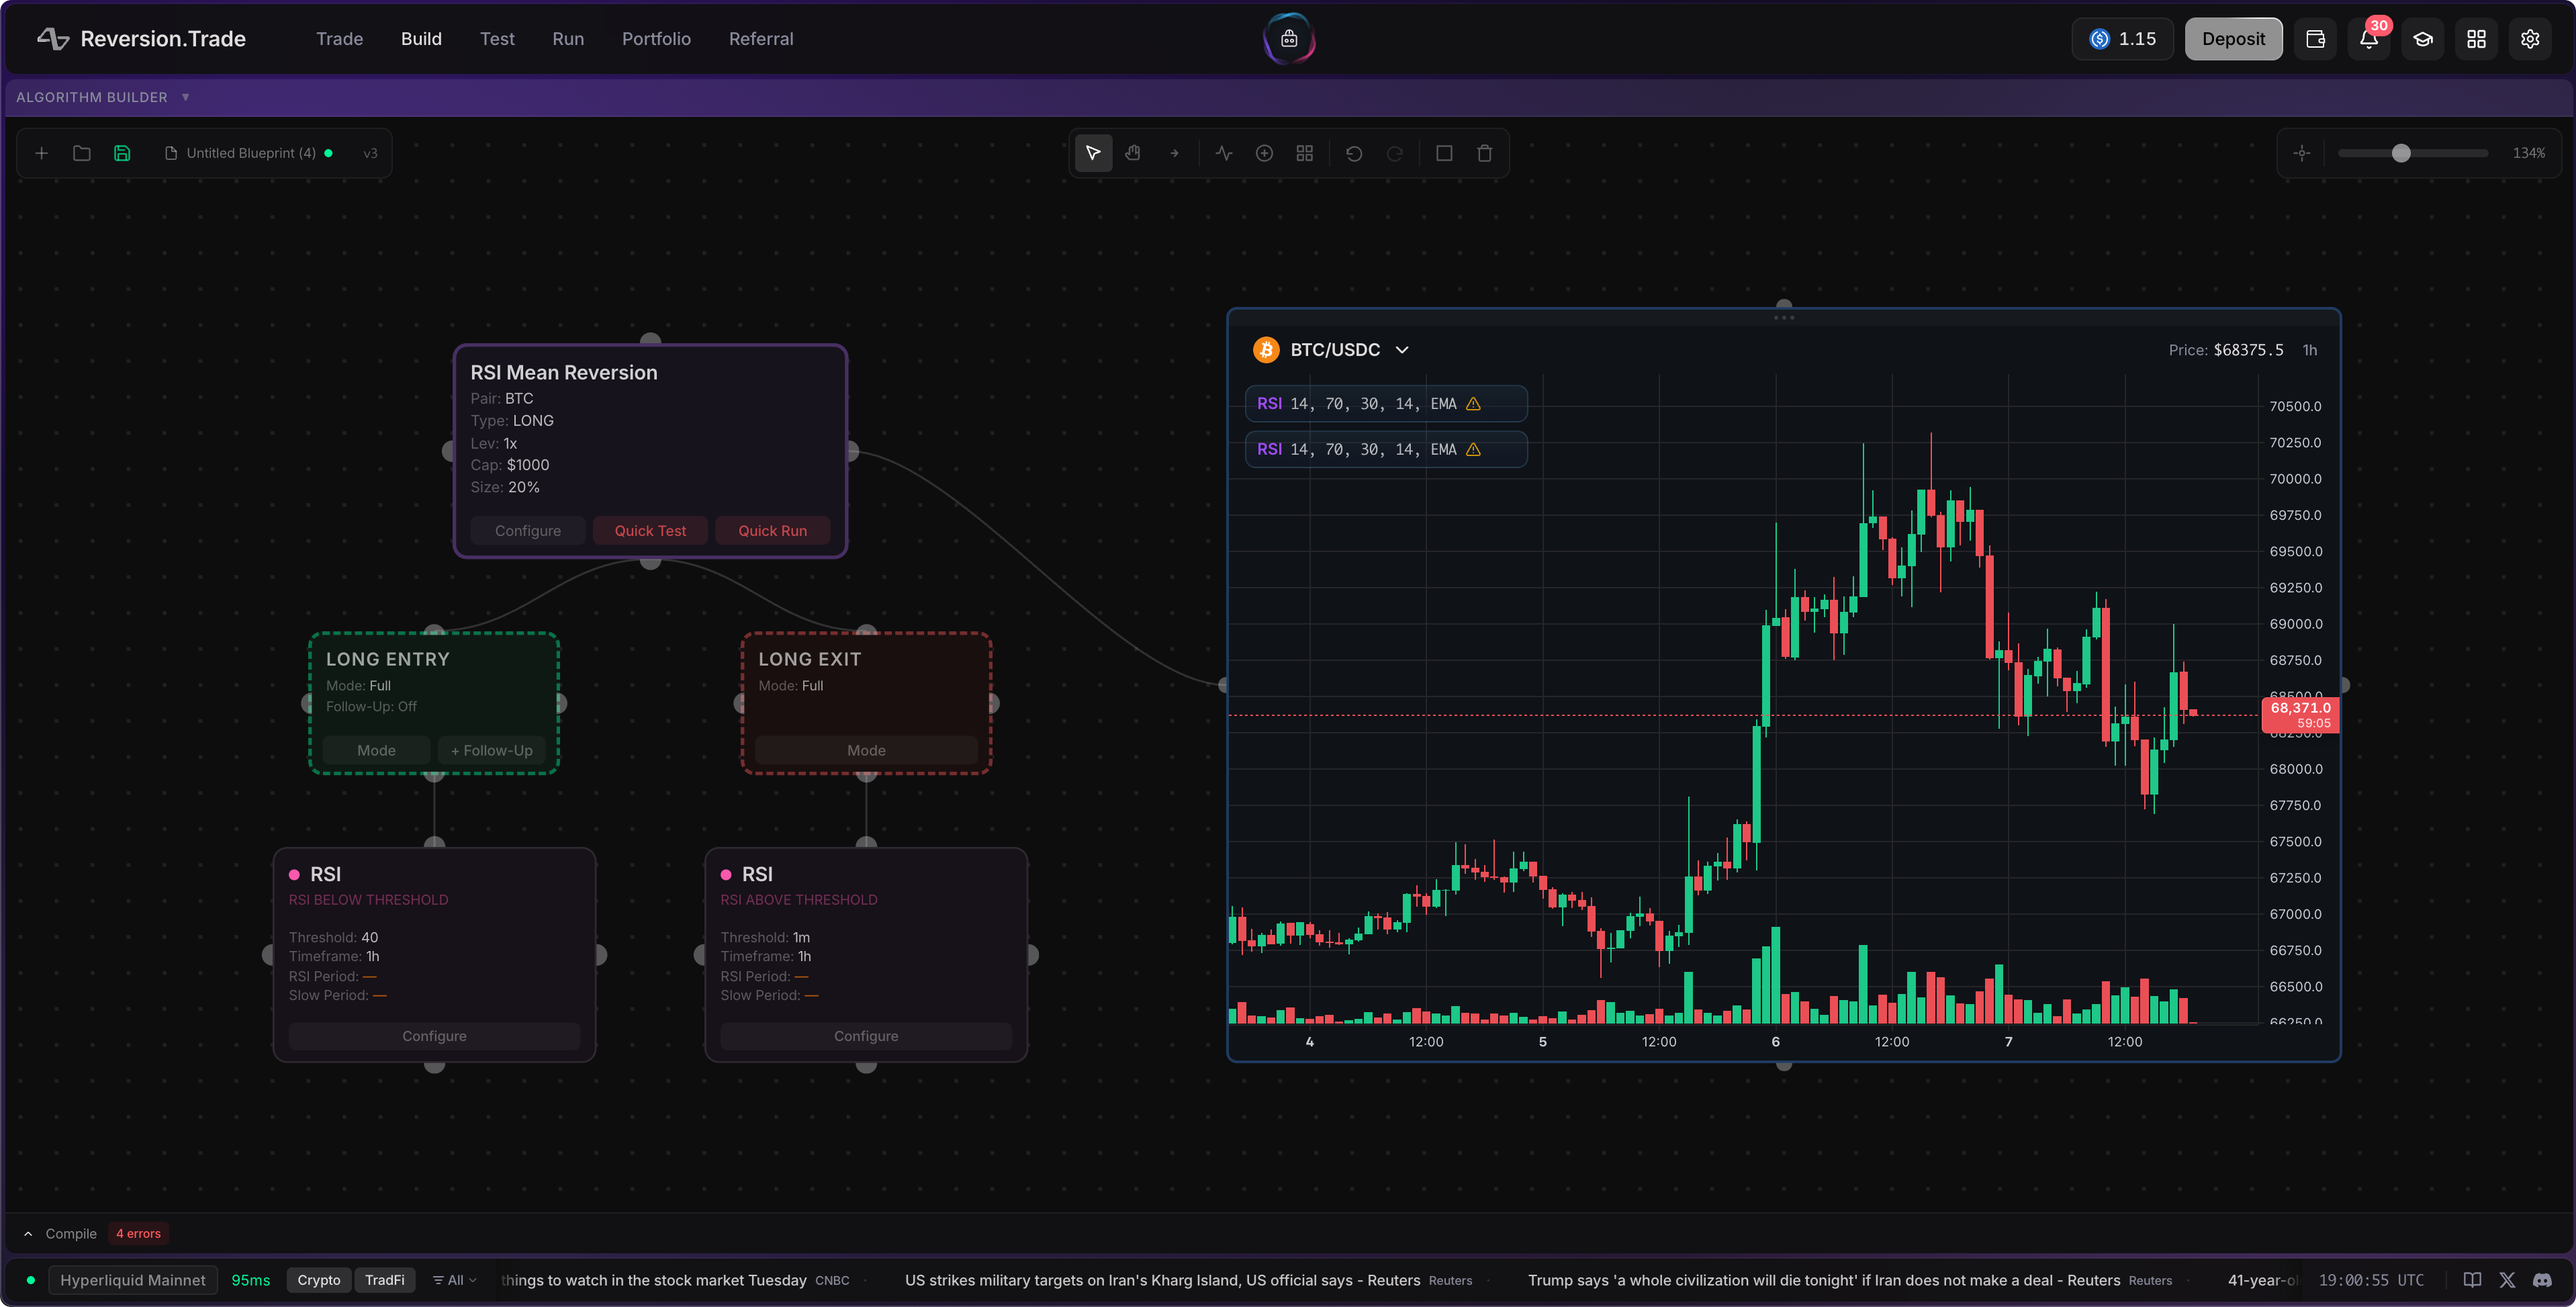
The template drops a pre-wired set of nodes onto your canvas: a Config node, RSI indicators, entry/exit groups, and stop loss/take profit.
-
Explore the Canvas
Take a moment to understand what you see:
- Config node (purple border) — the core of your algorithm. Sets the name, trading pair, strategy type, capital, and leverage
- Indicator nodes (colored by category) — technical analysis signals like RSI, EMA, MACD
- Entry/Exit Group nodes — collect indicator signals to define when to enter and exit trades
- Stop Loss / Take Profit nodes — define your risk management rules
- Connection lines — show the flow of data between nodes
Navigation:
- Scroll to zoom in and out
- Click and drag on the background to pan around
- Press Home to reset the camera to center
-
Configure the Algorithm
Click Configure on the Config node (purple border) to open its settings. Fill in:
Setting Value Name My RSI Strategy Symbol BTC/USDC Type LONGCapital $1,000 Leverage 2x Position Size 50% 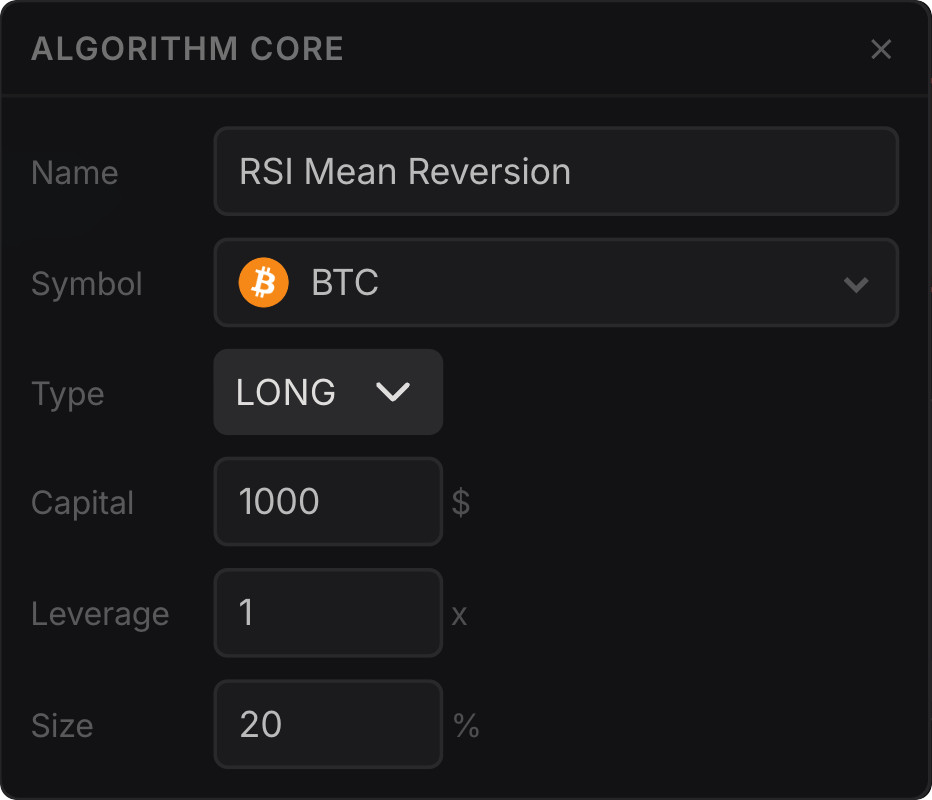
-
Configure the Indicators
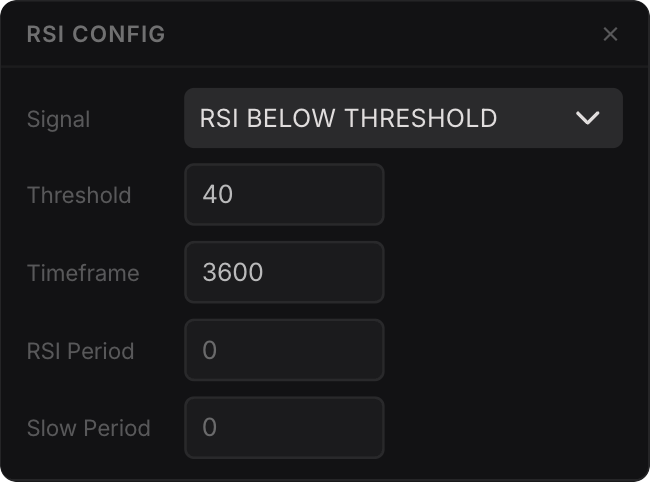
Click Configure on each indicator node to set its parameters. For the RSI Mean Reversion template:
- Entry RSI: Signal =
value_below_threshold, Threshold =30(buy when oversold) - Exit RSI: Signal =
value_above_threshold, Threshold =70(sell when overbought)
Each indicator shows its current parameters directly on the node, so you can see your configuration at a glance.
- Entry RSI: Signal =
-
Set Your Risk Management
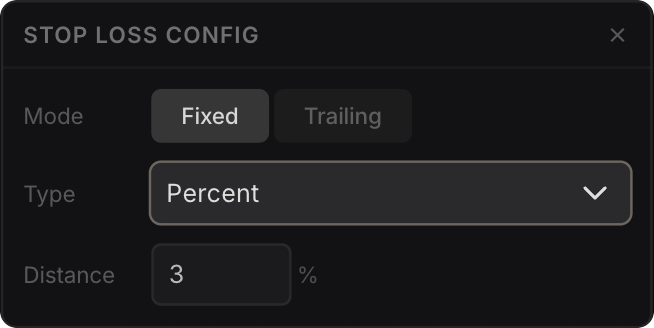
Click Configure on the Stop Loss and Take Profit nodes:
- Stop Loss: Mode = Fixed, Type = Percent, Distance = 5%
- Take Profit: Mode = Fixed, Type = Percent, Distance = 10%
This means every trade is protected — if price drops 5% you’re stopped out, if it rises 10% you take profit.
-
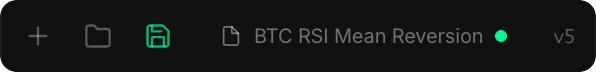
Save Your Blueprint
Click the Save button in the top-left corner (or press Ctrl+S). The save indicator turns green when saved successfully.
Your blueprint is stored with version history — every change you save creates a new version, so you can always roll back.
-
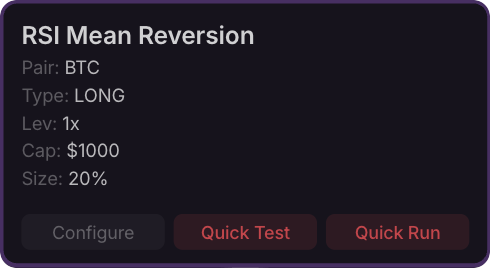
Quick Test Your Strategy
Click Quick Test on the Config node. This saves the blueprint if needed, compiles the selected algorithm, and opens the Test workspace with that algorithm pre-selected.
From there, click Run Backtest to test the strategy against historical data. You’ll see the equity curve, win rate, Sharpe ratio, trade history, and detailed trade diagnostics.
-
Quick Run When You’re Ready
After you’ve tested the strategy, you can return to Build and click Quick Run on the Config node. This opens the Run workspace with the algorithm pre-selected so you can choose a run wallet, set live capital, and start execution.
Canvas Tips
Section titled “Canvas Tips”- Right-click anywhere on the canvas to add new nodes — indicators, logic gates, algorithm cores, and more
- Press I to quickly add an indicator, L for a logic gate
- Use AND/OR/NOT logic gates to combine multiple indicators into complex signals
- Ctrl+Z to undo, Ctrl+Shift+Z to redo
- The toolbar shows all available tools: Select (V), Pan (H), Connect (C), and more
What’s Next?
Section titled “What’s Next?”| Want to… | Go to |
|---|---|
| Test this algorithm | Test Walkthrough → |
| Learn all algorithm options in depth | Build Features → |
| Browse available indicators | Indicators Library → |